In the vast realm of candlestick patterns in the world of trading, the “Hanging Man Candle” is a term that often floats to the surface. This powerful candlestick pattern has the potential to provide traders with valuable insights into market trends and potential reversals. In this comprehensive guide, we will delve deep into the hanging-man candle, uncovering its formation, interpretation, key differences compared to the hammer candle, and its significance in chart analysis. So, fasten your seatbelts as we embark on a journey to demystify the hanging-man candle and equip you with the knowledge to make informed trading decisions.
What is a Hanging Man Candle?
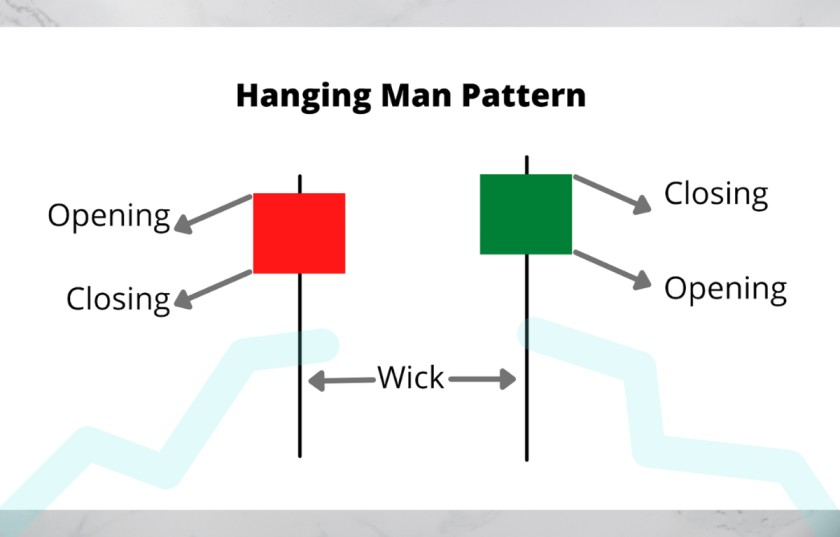
Before we dive into the intricacies of the hanging-man candle, let’s begin with the basics. A “Hanging Man Candle” is a candlestick pattern that typically forms at the end of an uptrend. It is characterized by a small body with a long lower shadow or wick and little to no upper shadow. The name “hanging man” is derived from the pattern’s appearance, which resembles a little man hanging from a noose.
In the context of candlestick chart analysis, is a single candlestick pattern that often appears in financial charts, especially in stock market or forex trading. It is considered a bearish reversal pattern and can provide traders with insights into potential changes in market sentiment.
The Hanging Man candlestick pattern, a commonly used tool in financial markets for technical analysis, carries both advantages and drawbacks. On the positive side, it serves as a bearish reversal signal, which can be valuable for traders seeking to anticipate shifts from bullish to bearish trends. It is relatively easy to identify on price charts, with its distinctive features of a small body, a long lower shadow, and little to no upper shadow. The pattern suggests potential selling pressure, as indicated by the long lower shadow. Furthermore, traders often wait for confirmation from a bearish follow-through on the next trading day to enhance its reliability.
On the downside, the Hanging Man pattern is not foolproof and can generate false signals, potentially leading to missed opportunities or trading losses. Its effectiveness depends on the broader market context and the chosen time frame, necessitating the use of additional technical indicators for a comprehensive analysis. In extremely volatile markets, where price swings are rapid and extreme, the Hanging Man pattern might not be as reliable. Additionally, this pattern is more suited for short-term or swing traders, making it less relevant for long-term investors. Lastly, the interpretation of candlestick patterns, including the Hanging Man, can be subjective and vary among traders, contributing to inconsistent results. In conclusion, the Hanging Man candlestick pattern can be a valuable tool when used in the right context and in conjunction with other analysis methods, but it should be applied with awareness of its limitations and potential for false signals, particularly in fast-moving markets.
A Hanging Man candlestick pattern is a technical analysis tool used in financial markets, particularly in trading stocks, forex, and cryptocurrencies. It’s typically considered a bearish reversal pattern, and traders use it to make predictions about future price movements. It’s discuss now what are the pros and cons of the Hanging Man candlestick pattern.
PROS
Bearish Reversal Signal: The Hanging Man is generally interpreted as a bearish reversal signal, indicating a potential change in the trend from bullish to bearish. This can be valuable for traders looking to enter short positions or liquidate long positions.
Easy to Recognize: The Hanging Man pattern is relatively easy to spot on a price chart. Which will making it accessible to both novice and experienced traders. Hanging Man pattern consists of a small body and a long lower shadow, along with a little to no upper shadow.
Suggests Weakness: The long lower shadow of the Hanging Man signifies that sellers pushed prices significantly lower during the trading session, which indicates potential selling pressure.
Confirmation: Traders often wait for confirmation in the form of a bearish follow-through on the next trading day to validate the Hanging Man pattern, increasing its reliability.
CONS
False Signals: Like many technical patterns, Hanging Man candles can produce false signals. Not all Hanging Man patterns lead to bearish reversals, and relying solely on this pattern may result in missed trading opportunities or losses.
Context Matters: The effectiveness of a Hanging Man pattern depends on the broader market context and the time frame in which it appears. It should be used in many ways with conjunction and with so many others technical indicators for analysis.
Market Volatility: The Hanging Man pattern may not be as reliable in extremely volatile markets where price swings can be sudden and dramatic. In such conditions, other indicators might be more useful.
Short Term Focus: Hanging Man patterns are generally more suited for short term traders or swing traders. Long term investors might find them less relevant for their investment strategies.
Subjective Interpretation: Interpretation of candlestick patterns, including the Hanging Man, can be subjective. Every traders analysis may view differently for the same pattern, which results market lead to inconsistent reversal.
What is Hanging Man Candle Pattern Signify?
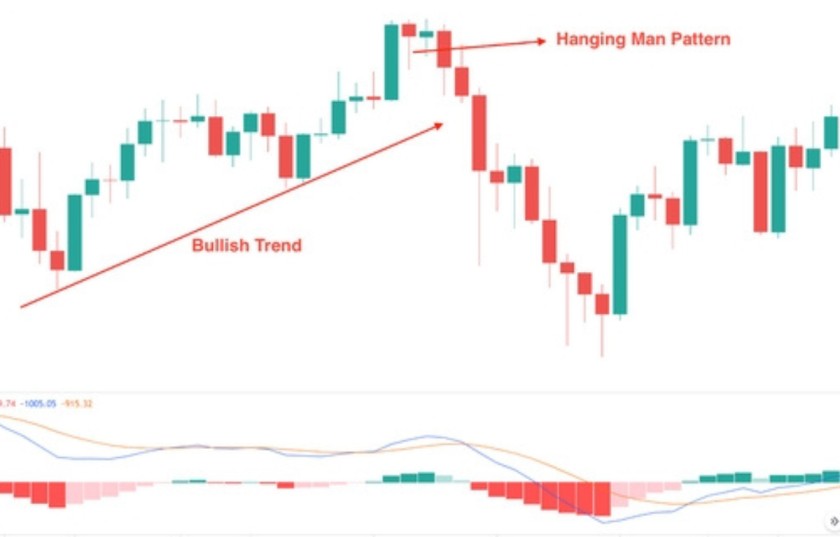
The formation of a hanging man candle can be a crucial signal for traders. It signifies a potential reversal of the current uptrend and a shift in market sentiment from bullish to bearish.
Small Body:
The small body of the hanging man candle suggests that the opening and closing prices are very close to each other, indicating indecision in the market.
Long Lower Shadow:
The long lower shadow, often referred to as the “wick,” represents the lowest price the asset reached during the trading session. This shadow reflects the bears’ attempt to push prices lower but failing to sustain the downward momentum.
Little to No Upper Shadow:
The absence of an upper shadow implies that there was little resistance from the bulls during the session. It suggests that the bears had more control over the market.
Table of Contents
What to Look for in a Hanging Man Candlestick on a Chart
Now that we’ve established what a hanging man candle is and its basic components, let’s explore how to identify it on a price chart effectively. To spot a hanging man candlestick, look for the following criteria
- Small Body: As mentioned earlier, the candle should have a small body, indicating a close opening and closing price.
- Long Lower Shadow: The most distinctive feature is the extended lower shadow, which should be at least twice the length of the body.
- Little to No Upper Shadow: Ideally, there should be little to no upper shadow, signaling minimal bullish resistance.
What Spotting the Differences: Hanging Man Candle vs. Hammer Candle:
One common source of confusion for traders is distinguishing between the hanging man and the hammer candle. While both patterns have similar shapes, they convey opposite messages. Here’s how to differentiate between them,
Hanging Man Candle: Forms at the end of an uptrend and signals a potential reversal from bullish to bearish.
Hammer Candle: Occurs at the end of a downtrend and indicates a potential reversal from bearish to bullish.
The Power of Interpretation: Trading with the Hanging Man Candle
Interpreting the hanging man candle is not just about recognizing its formation but also understanding its implications. When you encounter a candlestick on a chart, consider the following factors,
Confirmation: Wait for confirmation in the form of a bearish candle after the hanging man to validate the potential reversal.
Volume: Higher trading volume during the hanging man formation strengthens the signal.
Trend Analysis: Assess the context of the hanging man candle within the broader trend. Is it a standalone signal or part of a more significant pattern?
Support and Resistance: Identify key support and resistance levels that may coincide with the hanging man formation, as they can influence its significance.
Timeframes: When Investors do trading in any Stock frist to Consider the timeframe i.e. 5Min/ 15Min/ 30Min/ 1Hour. If looking for long term Weekly/ Monthly you are trading on any Stock. The impact of this candle can vary between intraday and longer-term charts.
Conclusion
In conclusion, the hanging man candle is a powerful tool in a trader’s arsenal for analyzing market sentiment and potential trend reversals. By mastering the art of recognizing and interpreting this candlestick pattern, you can make more informed trading decisions and stay ahead in the dynamic world of financial markets.
Frequently Asked Questions (FAQs)
Can the hanging man candle appear in any market?
Yes, the hanging candle can be observed in various financial markets, including stocks, forex, and cryptocurrencies.
Is it necessary to wait for confirmation after spotting a hanging man candle?
While it's not mandatory, waiting for confirmation in the form of a bearish candle can increase the reliability of the signal.
Are there any other candlestick patterns similar to the hanging man?
Yes, there are patterns like the shooting star, which resemble the hanging man but have distinct implications.
What role does psychology play in the formation of the hanging man candle?
Psychology is significant, as the hanging man reflects a shift from bullish to bearish sentiment, indicating uncertainty and potential selling pressure.
How can traders incorporate the hanging man candle into their risk management strategies?
Traders can use the hanging man as a signal to tighten stop-loss orders and manage risk more effectively in their trades.