In the world of trading, knowledge is power, and one of the most valuable tools at a trader’s disposal is the candlestick chart. Among the myriad of candlestick pattern variations, understanding the inverted hammer pattern is crucial. This bullish reversal pattern can provide valuable insights, especially when analyzing market momentum and trends. In this article, we will delve into the intricacies of the inverted hammer candlestick and how to effectively incorporate it into your trading strategy.
Unveiling the Inverted Hammer Candle Stick
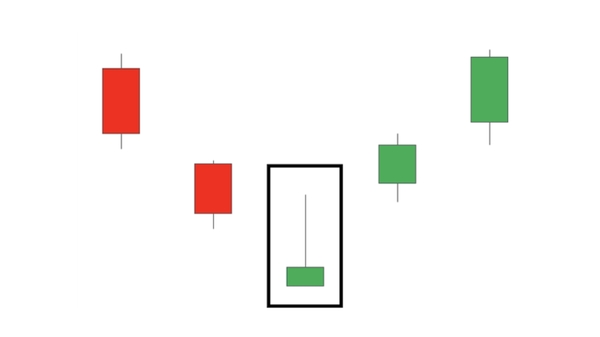
The inverted hammer is a distinctive candlestick pattern candlestick pattern characterized by three key components: a short real body resembling a rectangle, a significantly extended upper shadow (wick), and a tiny or nonexistent lower wick. This pattern gets its name from its resemblance to an upturned hammer.
Trading Strategies with the Inverted Hammer
While identifying the inverted hammer candle stick is essential, it alone does not guarantee successful trading, whether in the forex, stock, or cryptocurrency markets. To enhance the accuracy of your trading decisions, consider these additional factors:
Double Bottom Pattern:
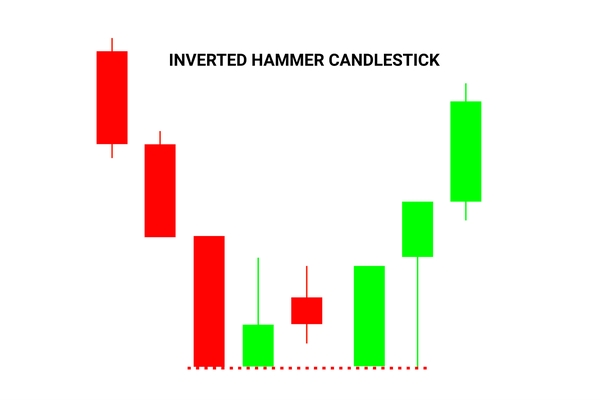
The Double Bottom pattern, resembling the letter “W,” consists of two nearly equal consecutive lowest points with a moderate peak in between. When an inverted hammer Candle Stick appears at the second bottom, it validates the Double Bottom pattern, indicating a potential upward move. To confirm, wait for the market to close above the inverted hammer’s high before considering a long position.
V-Bottom Pattern:
The V-Bottom pattern, shaped like the letter “V,” occurs when price momentum shifts from aggressive selling to aggressive buying. The inverted hammer Candle Stick typically forms just before a trader enters the trade. To initiate a long position, wait for the market to close above the inverted hammer’s high, and use support levels for guidance, as the price often bounces off trends.
Combining with Technical Analysis:
Table of Contents
Trading Rules for Inverted Hammer Patterns
Identify Reversal Points: Begin by identifying potential reversal points on the price chart. Look for areas where the market trend might be ready to change direction. These can include support and resistance levels, trend line, or areas where price has consistently turned in the past.
Timing Your Entry: Timing is crucial when trading with Inverted Hammer patterns. After you spot an Inverted Hammer candlestick, it’s advisable to wait for confirmation. This means waiting for the next candlestick to form and ensuring that it supports the potential reversal indicated by the Inverted Hammer. While this strategy may result in a slightly higher entry price, it can reduce the risk of entering a false trade.
Implement Stop-loss: Always use stop-loss orders to manage your risk. Set your stop-loss level a few units (typically 2-3 units) below the lowest point of the Inverted Hammer candlestick. This is essential to limit potential losses in case the trade goes against you. It’s crucial to stick to your stop-loss level and not deviate from it.
Analyzing Key Factors: Pay close attention to certain key factors when trading with Inverted Hammer patterns.
Upper Wick Length: The longer the upper wick of the Inverted Hammer, the higher the likelihood of a trend reversal.
Candle Color: While the color of the candlestick (green for bullish or red for bearish) can provide some information, it’s not as significant as the candlestick’s overall position and shape.
Confirmation Candlestick: Consider the size and shape of the confirmation candlestick that follows the Inverted Hammer. A strong, supporting candlestick can enhance the reliability of the signal.
What is Bullish Inverted Hammer Candlestick
A Bullish Inverted Hammer Candlestick pattern is a specific that often appears on financial charts and is considered a potential indicator of a bullish reversal in the price trend of a asset, for example, a stock, Currency Pair, or cryptocurrency. This pattern is significant for traders and investors as it can offer insights into potential buying opportunities.
Also in other way A Bullish Inverted Hammer suggests that after a downtrend, there is potential for a reversal towards an uptrend. It indicates that buyers are starting to regain control, pushing prices higher despite initial selling pressure. However, like all technical patterns, it should be used in conjunction with other analysis tools and indicators to make informed trading decisions.
Here are the key characteristics of a Bullish Inverted Hammer.
Appearance: The Bullish Inverted Hammer has a distinctive shape, consisting of a short real body (the rectangular part of the candlestick) with a small upper shadow (wick) and a more extended lower shadow. It gets its name because it looks somewhat like an upturned hammer.
Position: This pattern typically occurs at the end of a downtrend, signaling a possible trend reversal from bearish (downward) to bullish (upward).
Upper Shadow: The upper shadow of the Bullish Inverted Hammer is relatively short compared to the lower shadow. It represents the price’s attempt to move higher during the trading period but was met with resistance.
Lower Shadow: The lower shadow, on the other hand, is more extended and signifies that sellers tried to push the price lower but were ultimately unsuccessful.
Real Body: The real body of the candlestick is usually small and can be either bullish (close price higher than open) or bearish (close price lower than open). The color of the real body is less critical than its position within the overall trend.

What is Bearish Inverted Hammer Candlestick
A Bearish Inverted Hammer Candlestick Pattern is a considered a potential bearish reversal signal in technical analysis. It is the opposite of the regular inverted hammer, which is a bullish reversal pattern. The bearish inverted hammer typically appears at the end of an uptrend and suggests a possible change in market sentiment from bullish to bearish.
It’s important to note that, like all candlestick patterns, the bearish inverted hammer should not be used in isolation for trading decisions. It is often more reliable when confirmed by other technical indicators or chart patterns. Traders commonly look for follow-up bearish price action or signals to confirm the potential reversal before taking any trading positions based on the bearish inverted hammer.
Here are the key characteristics of a bearish inverted hammer.
Appearance: A bearish inverted hammer consists of three main parts: a short real body at the top, an extended upper shadow (wick), and little to no lower shadow. The real body is usually at the upper end of the candlestick.
Position: The bearish inverted hammer forms at the peak of an uptrend, indicating that the bulls (buyers) tried to push the price higher but were met with resistance from the bears (sellers).
Bearish Signal: This pattern suggests that the bullish momentum is weakening, and there is a potential for a trend reversal. Traders interpret it as a sign that the market may start moving downward.

Shooting Star vs Inverted Hammer Candlestick
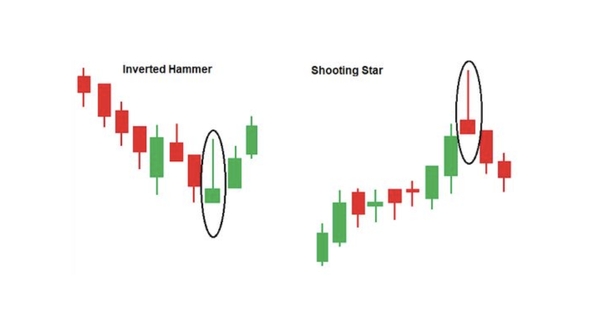
The Shooting Star and Inverted Hammer CandleStick are two distinct candlestick patterns used in technical analysis to make trading decisions.
While the Shooting Star and Inverted Hammer may look similar at first glance, their positions in the trend and their respective implications make them distinct candlestick patterns used by traders to make informed decisions about market direction.
They have similar appearances but carry different implications for market trends. Let’s compare the two.
Shooting Star Candlestick:
A Shooting Star candlestick Appearance has a small real body near the bottom of the candle, with a long upper shadow (wick) and little to no lower shadow. It looks like an inverted “T” or a small body with a long tail on top.
The Shooting Star typically Position appears at the end of an uptrend, signaling potential weakness in the bullish momentum. It suggests that during the trading session, the price opened near its low, rallied significantly during the session, but then closed near the session’s low.
The Shooting Star is considered a Bearish Signal reversal pattern. It implies that sellers have stepped in, and there may be a shift from bullish to bearish sentiment. Traders often view it as a sign that a trend reversal to the downside could be imminent.
Inverted Hammer CandleStick
An Inverted Hammer candlestick Appearance has a small real body near the top of the candle, with a long upper shadow and little to no lower shadow. It resembles a hammer turned upside down.
The Inverted Hammer typically forms at Position the end of a downtrend, suggesting a possible reversal. It indicates that during the trading session, the price opened near its low, moved higher during the session, and then closed near its high.
The Inverted Hammer is considered a Bullish Signal reversal pattern. It implies that buyers have started to gain control, and there may be a shift from bearish to bullish sentiment. Traders often see it as a sign that a trend reversal to the upside could be on the horizon.
The Key Differences between Both Candle Stick
Trend Reversal Direction:
The primary difference between the two patterns is their implications for trend reversals. The Shooting Star is bearish and suggests a potential reversal from an uptrend to a downtrend, while the Inverted Hammer is bullish and indicates a potential reversal from a downtrend to an uptrend.
Position in the Trend: The Shooting Star appears at the peak of an uptrend, while the Inverted Hammer forms at the bottom of a downtrend.
Real Body Position: In the Shooting Star, the small real body is near the bottom of the candle, whereas in the Inverted Hammer, the small real body is near the top.
Like all trading patterns, the Inverted Hammer CandleStick has its advantages and disadvantages.
Pros Advantages:
Easy Identification: The Inverted Hammer CandleStick is easy to spot on a chart and is distinguishable from other patterns.
High Reward Potential: It offers a relatively high chance of successful trend reversal.
Cons Disadvantages:
No Guarantee: Even when correctly identified, the pattern can fail without clear reasons.
Short-term Signals: The Inverted Hammer CandleStick may indicate a short-term spike rather than a long-term trend, leading to potential loss of profits.
Confusion with Shooting Star: Inexperienced traders may confuse the Inverted Hammer CandleStick with its bearish counterpart, the shooting star.
Distinguishing Between Inverted Hammer and Shooting Star. While the Inverted Hammer CandleStick and Shooting Star share similar appearances, they have distinct positions on the chart. The inverted hammer signals the end of a downtrend, while the shooting star appears at the top of a trend, indicating a possible downward price movement.
Conclusion:
Candlestick charts are invaluable tools in the realm of technical analysis, but no pattern should be considered in isolation. The inverted hammer, while powerful, is most effective when used in conjunction with other signals and technical analysis. Successful trading requires a holistic perspective and an understanding of the market’s nuances. An inverted hammer candlestick can be a valuable addition to your trading arsenal when applied judiciously.
For those looking to master the art of trading, remember that knowledge and experience are your greatest allies. Utilize candlestick patterns like the inverted hammer as part of your comprehensive trading strategy to achieve success in the ever-evolving world of finance.
The inverted hammer can be applied to various assets, including forex, stocks, and cryptocurrencies, but its effectiveness may vary.
Yes, there are numerous candlestick patterns, each with its unique significance. Learning about different patterns can enhance your trading skills.
Familiarity and practice are key. Continuously study candlestick patterns, and over time, you’ll become adept at distinguishing them.
While the inverted hammer is a valuable tool, it is recommended to combine it with other technical analysis and signals for more reliable trading decisions.
One common mistake is misinterpreting the pattern or failing to confirm it with other indicators. Additionally, ignoring stop-loss levels can lead to significant losses. Always follow a well-thought-out trading plan.


